Boarman
Species Level Spectral Analysis WorldView 2 Imagery and Spectrometer
Ryan Boarman California State University, Long Beach1250 Bellflower Boulevard, Long Beach, California 90840
Abstract
Abstract text goes here…
Introduction
The focus of this research involved the collection and analysis of plant species level spectral signatures on the island of Kauai. Using a spectrometer to generated species level signatures and comparing those signatures to WorldView 2 imagery will help identify wether it’s possible to use theses technologies to locate and map individual plant species.
Methods
The processes involved the collection of ground-based spectral readings using a StellarNet EPP2000 spectrometer and the comparison of the spectrometer readings to spectral data contained in WorldView 2 imagery with .5 meter spatial resolution and eight spectral bands. Spectrometer Collection
The spectrometer is connected to a YUMA computer to record and generate data
Spectrometer was 1-12 inches away from target based on light conditions
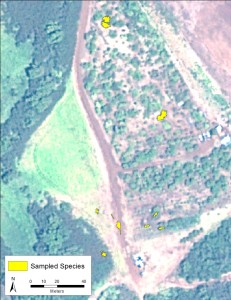
Eleven species were sampled
Five spectral signatures were collected per species
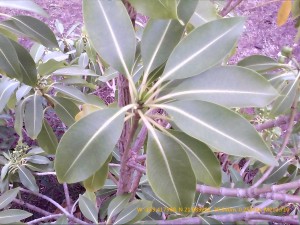
Rauvolfia sandwicensis
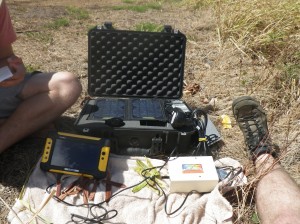
StellarNet EPP2000 spectrometer connected to a YUMA.
The five spectral samples of each species were averaged to produce a single integrated spectral signature for each species samples
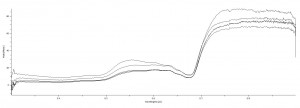
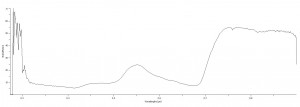
Spectral radiance from Rauvolfia sandwicensis
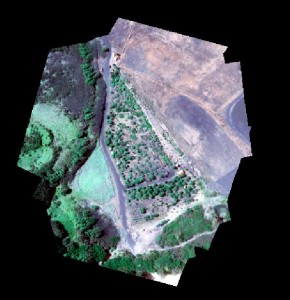
•Fifteen images acquired from GateWing X100 UAS were mosaiced and georeferenced with a spatial resolution of 0.12 meters
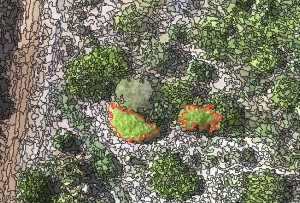
•With the mosaiced image, polygons of the sampled species were created using eCognition object based image analysis
•The generated objects for individual plants were imported into ERDAS
•Theses polygons were used with Hyper spectral analysis tool to generate reflectance signature graphs from data acquired from WorldView 2
Data
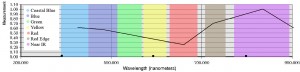
Spectrometer average watts/meter2 separated into bands of WorldView 2. Averages were created with values obtained from the spectrometer
Hao, Rauvolfia sandwicensis
Milo, Thespesia populnea
Coastal Blue 400-450 nm
6.7 watts/meter 2
9.9 watts/meter 2
Blue 450-510 nm
9.6 watts/meter 2
12.8 watts/meter 2
Green 410-580 nm
20.2 watts/meter 2
21.3 watts/meter 2
Yellow 585- 625 nm
13.8 watts/meter 2
12.5 watts/meter 2
Red 630-690 nm
8.7 watts/meter 2
9.8 watts/meter 2
Red Edge 705-745 nm
43.1 watts/meter 2
50.8 watts/meter 2
Near IR 770-895 nm
52 watts/meter 2
63.4 watts/meter 2
Hao, Rauvolfia sandwicensis
Spectral reflectance of Hao from WorldView 2 data
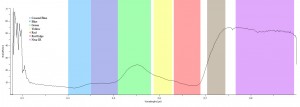
Spectral radiance of Hao from spectrometer data
Milo, Thespesia populnea

Spectral reflectance of Milo from WorldView 2 data
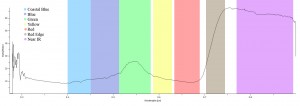
Spectral radiance of Milo from spectrometer data
Conclusions
The research reported here are the initial steps of a larger research question. The larger question asks if it is possible to generate spectral signatures of individual plant species to apply to a larger area to locate and map plants at a species level. The research done on Kauai demonstrates the ability to use remote sensing to segment species level vegetation utilizing UAS imagery, extract reflectance graphs from high resolution multispectral imagery, find the average spectral readings from plant species, visually compare the difference between data generated from a spectrometer and data from WorldView 2 imagery. From the initial results the graphs show some similarities between the spectrometer and WorldView 2. I believe the results suggest with more research, UAS imagery with multispectral cameras, and more time, it’s plausible to expand the methods to larger areas to potentially find and map individual plant species.
I would like to thank, Dr. Chris Lee, Dr. Suzanne Wechsler, Dr. Carl Lipo, Briton Voorhees, Jake Kovalchik, Mike Ferris, David Burney, and Lida Burney for their assistance with the project. This research was conducted as part of the National Science Foundation Research Experiences for Undergraduates with California State University Long Beach. NSF Award #1005258
Future work for this project includes:
Converting WorldView 2 data from percent reflectance to radiance
Extracting radiance statistics from WorldView 2 to quantitatively analyze the differences between the two measurements
Applying spectral signatures to image analysis software to locate and map plants at a species level
Limitations
•Many variables affect the spectral signatures of the spectrometer such as cloud cover, amount of light, human error and sample size
•Manual aggregation of individual plants species segments within eCognition
•The use of Photoscan to mosaic GateWing imagery
Acknowledgement
I would like to thank, Dr. Chris Lee, Dr. Suzanne Wechsler, Dr. Carl Lipo, Briton Voorhees, Jake Kovalchik, Mike Ferris, David Burney, and Lida Burney for their assistance with the project. This research was conducted as part of the National Science Foundation Research Experiences for Undergraduates with California State University Long Beach. NSF Award #1005258