Yourish
Currently working with revision @ 2012-07-06 17:24:01 by admin. Current version
Contents
[ hide ]
Assessing the effectiveness of UAS imagery in vegetation classification
Introduction
Remote sensing is an evolving discipline. In this study, cutting edge data collection techniques were applied on Kauai through a grant from the NSF.
The aim was to determine whether the high resolution imagery created by Unmanned Aerial Systems (UASs) such as the Gatewing X100 can be more effective than current, lower spatial resolution World View 2 (WV-2) imagery at classifying vegetation coverage types.
Higher spatial resolution is thought to be superior. The goal of this study was to see if this holds true or if the newly collected data is in fact too cumbersome to analyze and not worth the investment required.
Methodology
(1) Data was collected using imagery from a Gatewing X100 on June, 22 2012. Photos of the area of interest (AOI) were then selected and mosaiced into a single photo using Agisoft Photoscan (fig.1). This image was geo-rectified using WV-2 with a resulting Root Mean Square Error of .015.
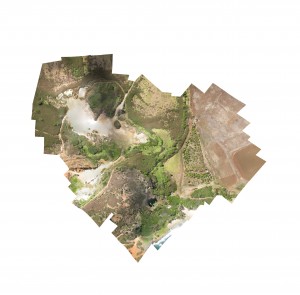
Fig. 1. Study Area..
Images are from Gatewing
x100. Photoscan was used to create mosaic.
(2) This image was used to pan-sharpen available WV-2 imagery to increase its resolution from a previous peak of .5 meters down to .26 meters Three pan-sharpening methods were used (High Pass Filtering, Ehler’s Fusion, and Hyper -spherical Color Space Resolution merge) but HPF seemed the best option (fig. 2).
(3) Fifty-two points were collected throughout the study area. Twenty-eight were control points used to set up a supervised classification, twenty-four were check points used to assess the classification’s validity (fig. 3). The points were grouped based on the GAP analysis.
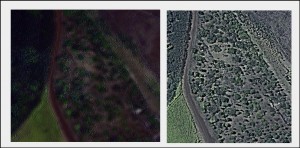
Fig. 2. Left: WV-2 imagery pan-sharpened using Ehler’s Fusion Method.
Right: Same, but using HPF Method. Both used red band to reduce scattering.
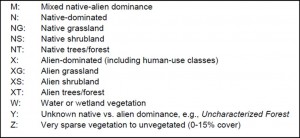
GAP is a national program aimed at mapping the locations of native species. In Hawaii the analysis uses twelve classes (fig. 4). This was used as a class system upon which the comparison could be based.
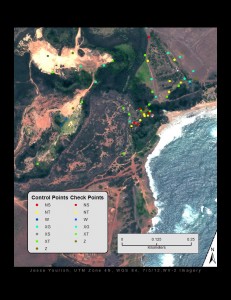
Fig. 3. AOI with collected GPS locations for use in classifying and testing.
Twenty four of the checkpoints were within the WV-2 image, 22 were contained in the UAS image. The UAS sharpened image had a higher accuracy:
Table 2. Shows how many of the checkpoints were accurately classified in each image.
The UAS sharpened imagery was more effective at classifying alien grasses, alien shrubs, and native shrubs, equally effective with native trees and water/wetlands, and less effective with non-vegetated land.
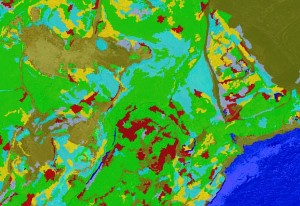
Fig. 4. Supervised classification results for .5m
resolution WV-2 imagery
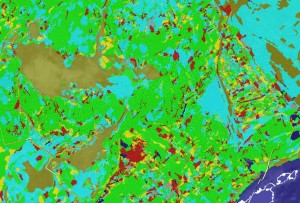
Fig. 5. Supervised classification results for .26m
resolution UAS sharpened imagery
Conclusion
This analysis was conducted with the aim of determining the effectiveness of the Gatewing X100 in vegetation classification. These results indicate some promise.
The imagery with .26m pixel size created using Gatewing X100 photos led to a much more effective classification scheme than that taken from only WV-2 with a pixel size of .5m as evidenced by the success rates of 82% and 63% respectively.
This indicates that the imagery collected can be useful for such tasks and that the Gatewing X100 is a viable data collection method.
Limitations & The Future
(1) Small sample size, only one study area
(2) No way to know which pan-sharpening method is actually best
(3) With such small pixels the accuracy of some points is ambiguous
(4) Using Photoscan to mosaic images may have led to some distortion
What’s Next?
The promising results of this study indicate that it could be worthwhile to look deeper into this subject. Conducting more intensive studies would give us a better idea of how effectively UAS imagery can be merged with available WV-2 imagery and then used to classify ground cover.
Acknowledgments
This research was made possible by funding from the National Science Foundation (grant # 1005258) as well as work by CSU Long Beach and Professors Lee, Wechsler, and Lipo and assistants Ted Ralston Mike Ferris, Briton Voorhees, Paul Nesbit and Jake Kovalchick. Thanks also to the National Tropical Botanical Gardens and David and Lida Burney. And of course my lovely parents Marly and Robert Yourish.
Sources Cited:
Gao, Jay. 2008. Digital Analysis
Klonus, Sascha & Ehlers, Manfred. 2008. Performance of evaluation methods
USGS GAP Analysis. 2006