Understanding interpolation
June 15, 2012Aloha kakou,
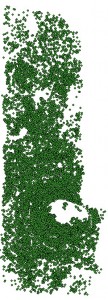
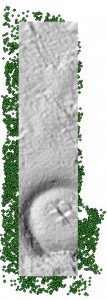
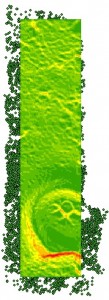
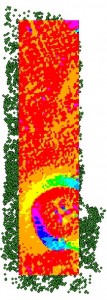
Finally got it! I have spent considerable time over the last few days learning various approaches for the interpolation of Digital Elevation Models from point cloud data. Spatial measurements are recorded for specific points in space and these points form a point cloud from which visual images may be created. These images are generated by interpolating the information into a raster grid. This is accomplished through the use of computer programs (in this case ArcGIS) that sample point information in order to create new spatial information that fills in the blanks between specific points. This process results in the creation of DEMs that simulate actual terrain topography. Below are images from my project employing the point cloud data from my orthophoto post yesterday. The first image is the point cloud for the Rapa Nui images obtained from the Gatewing X100. Successive images illustrate a general hillshade image, slope percentage, and directional aspect information for the same transect.
I plan to apply similar mapping techniques to create raster grids from airborne-platform acquired spatial data for portions of the Koloa field system on Kauai next week. These interpolation techniques will help map archaeological structures from an aerial point-of-view and refine the definition of agricultural features that might otherwise not be noticed from ground level.
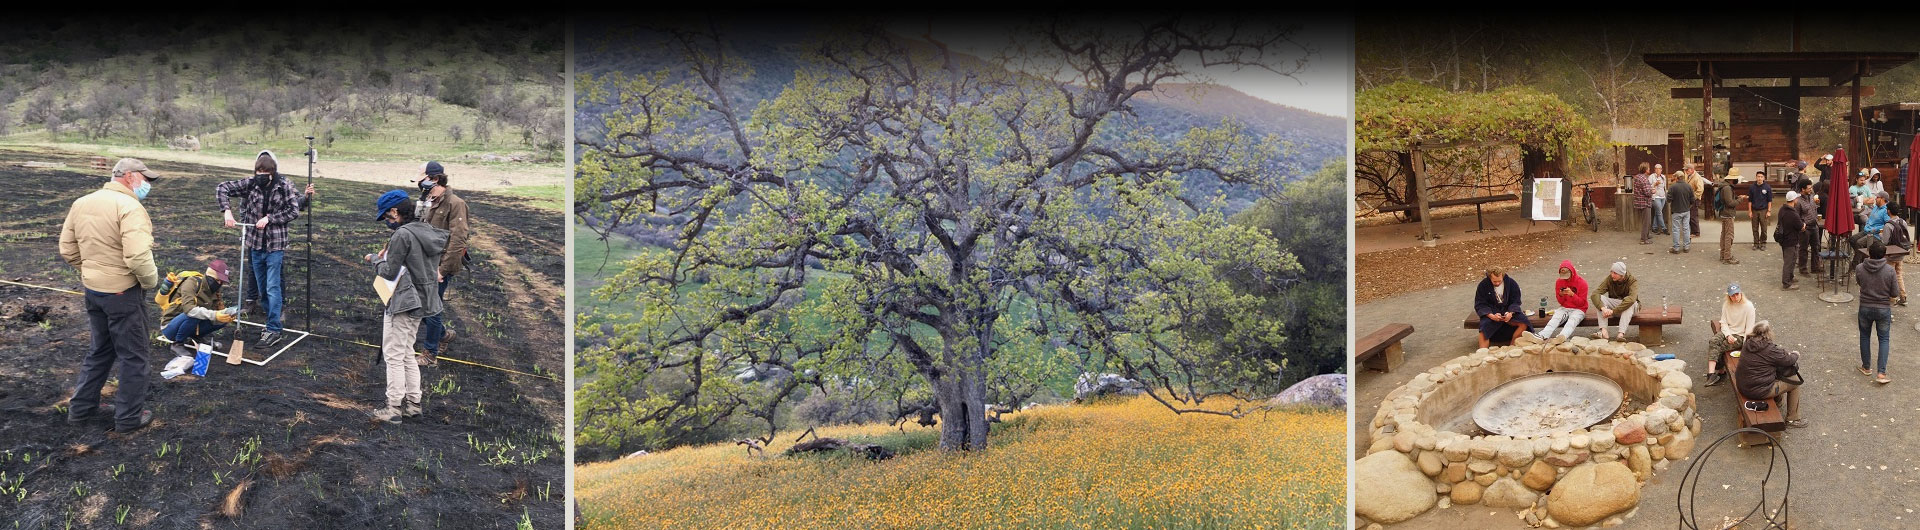
Most of today was spent familiarizing ourselves with the remote sensing equipment we will be using during the field portion of GRAM. We were introduced to the Bruker portable XRF, a handheld unit that emits X-rays toward the observed material and then measures the elemental composition of the material based upon the resulting fluorescence. We became acquainted with the EPP2000 by Stellarnet, Inc., a small spectrometer used to monitor electromagnetic spectral signatures of various materials in order to classify and group features on the ground thus creating a reference for later use. Additionally, we all participated in an exercise using different Garmin and Trimble handheld GPS units. Following a lecture on Polynesian archaeology by Dr. Lipo, we finally took the blimp for a test flight. The blimp is approximately 3 meters diameter and filled with helium. We fixed a picavet to one of the lines and attached real-color and near infra-red cameras to the bottom. These instruments will be used to acquire topographic information from which we can extract point cloud information for future data processing. I’ll post some blimp photos tomorrow. Good night.
– John Thornton O’Connor